
St George Mining
St George Mining (SGQ AU) owns the Araxá niobium and rare earths project in Minas Gerais, Brazil, with an Aug 2026 Mineral Resource Estimate (MRE) of 111.2Mt at 0.57% Nb₂O₅ and 3.57% TREO. Brazil dominates global niobium mining, while China and the US, the two largest consumers of the critical material, rely on imported niobium.
Niobium’s strategic role in defence, civil and new energy. Niobium and rare earths are part of supply chains that governments treat as strategic. Niobium has a critical role in national security and high-tech development. In defence, niobium superalloys go into hypersonic thermal-protection alloys, engine blades and gas turbines. In civil engineering, niobium steel is used in oil and gas pipelines, bridges and lighter vehicles, and niobium alloys are used in MRI magnets. In new energy, it is used in nuclear-power components and fast-charging EV battery materials. We expect non-steel niobium use to expand as supply catches up with demand. China, the EU and the US accounted for nearly two thirds of global consumption, with niobium on their critical-material lists.
Scarcity of niobium supply and the pure exposure offered by SGQ. Niobium production is heavily concentrated amongst a few major players. Aside from the near-monopolistic market structure, geographic concentration is high. Brazil mined 92.9% of the 112,000t produced worldwide in 2025. Three producers dominate supply: CBMM and CMOC in Brazil, plus Niobec in Canada. None of the three producers offers direct and pure equity exposure to niobium. SGQ is a listed and direct niobium play. In addition to niobium, Araxá contains 3.98Mt of total rare earth oxide (TREO) at a time when China’s export controls are pushing buyers to new suppliers.
Project development in Araxá is being de-risked. The Araxá project is in the same Barreiro carbonatite complex as CBMM’s mine, with access to roads, rail, renewable electricity and specialised workforce. The area is known for niobium reserves and a track record of niobium production, with established export infrastructure. The company has also brought in experienced former CBMM professionals to lead the project development.
Valuation. We initiate coverage of SGQ with a Buy rating and a target price of AUD 0.53. Our TP is based on a risked SOTP NPV of USD 1,633m. Of this, we value the niobium asset at USD 1,278m. We forecast Stage 1 produces 5,000tpa of ferroniobium from 2H 2027, and the 2Mtpa Stage 2 mill from FY2031E lifts output to about 9,800tpa at full run rate. Rare earths add USD 282m of risked value. As the company has explored less than 20% of the project area, exploration updates could provide re-rating catalysts in the near term.
SGQ owns the Araxá niobium and rare earths project in Minas Gerais, Brazil. The company acquired the asset from Itafos, a TSX-V listed fertiliser company, and completed the acquisition on 27 Feb 2025.
The Araxá project includes three permits 5km south of Araxá town in Minas Gerais. It is within the 5km-wide Barreiro carbonatite complex. CBMM’s niobium mine is close to the project to the south-east, and Mosaic’s phosphate mine is immediately to the south-west. The district has sealed roads, grid power, water, telecommunications and access to local mining labour.
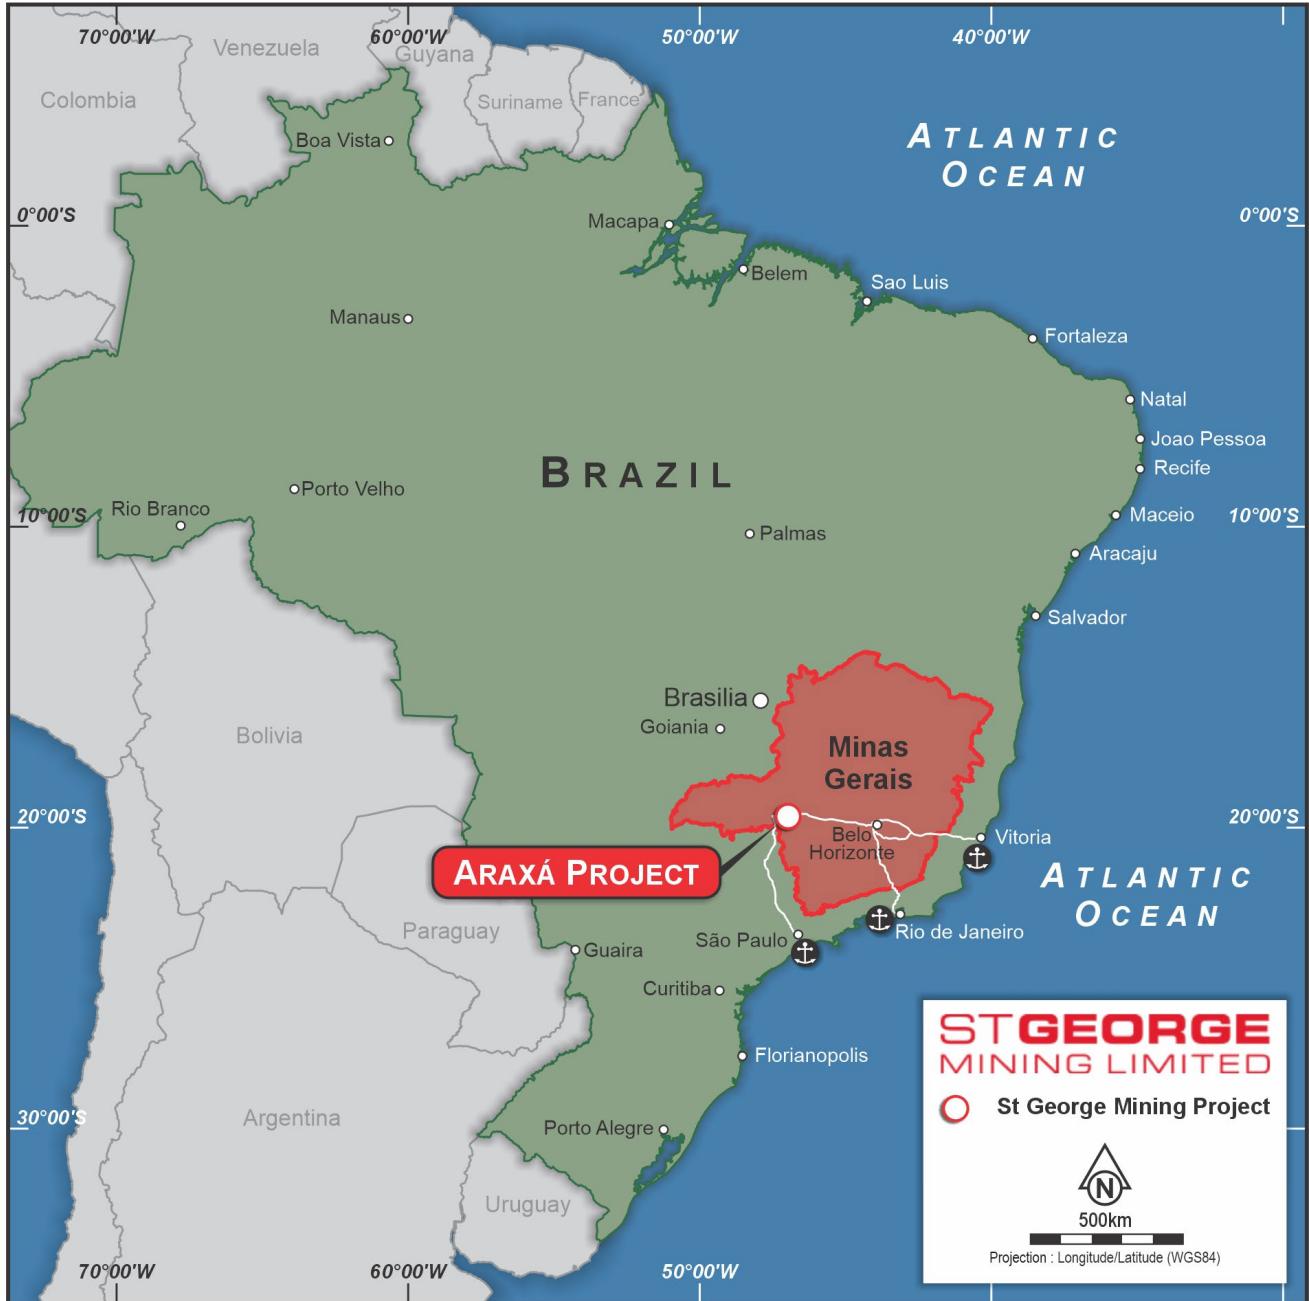
Source: Company.
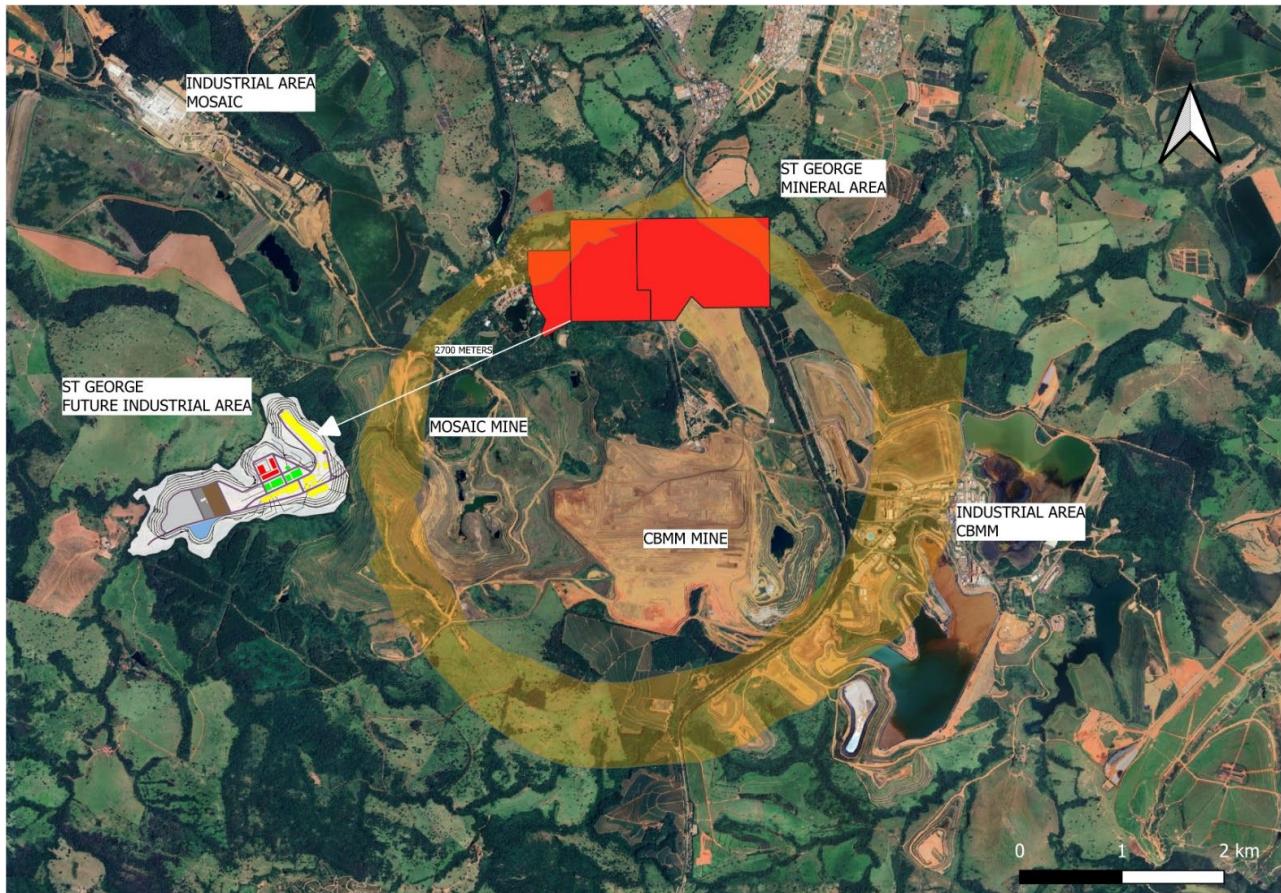
Source: Company.
Since completing the acquisition in 2025, SGQ has expanded its Mineral Resource Estimate (MRE). Applying a 2% Total Rare Earth Oxide (TREO) cut-off grade, the total resource tonnage rose from 40.6Mt in Apr 2025 to 70.9Mt in Mar 2026, and reached 111.2Mt in Aug 2026, nearly tripling in 16 months. The MRE includes 10% heavy rare earth elements such as terbium, dysprosium and yttrium.
Significant exploration upside remains, as large areas of the project are still unexplored. SGQ’s latest announcement notes that the MRE covers less than 20% of the project area. The company previously disclosed that only 19% of the project has undergone close-spaced drilling, a dense drilling pattern required to upgrade resources to higher confidence categories. While prospective carbonatite rocks were confirmed to a depth of 800m, the current MRE block model primarily focuses on the shallower depths up to 180m below surface.
Exhibit 3: Araxá mineral resource estimates since acquisition at 2% TREO cut-off
| MRE update | Tonnage | TREO | NdPr | Nb₂O₅ | Comment |
|---|---|---|---|---|---|
| Apr 2025 maiden MRE | 40.6Mt | 4.13% | - | 0.68% | First JORC resource report at 2% TREO cut-off |
| Mar 2026 upgrade | 70.9Mt | 4.06% | - | 0.62% | SRK Consulting estimate and +75% tonnage increase from the maiden MRE |
| Aug 2026 upgrade | 111.2Mt | 3.57% | 0.68% | 0.57% | SRK Consulting estimate and +57% tonnage increase from Mar 2026 |
Source: Company.
According to the August 2026 technical report, Araxá’s latest mineral resource stands at 111.2Mt at 3.57% TREO, 0.68% NdPr and 0.57% Nb₂O₅. This translates to contained metal inventories of 3.98Mt of TREO, 760,000 tonnes of NdPr oxides, and 630,000 tonnes of Nb₂O₅. Notably, 75.2Mt (or 68% of the total resource) falls into the Measured and Indicated (M&I) categories, the higher-confidence classifications used for economic mine planning (grading 3.64% TREO and 0.58% Nb₂O₅).
Additionally, the August 2026 update disclosed a separate 35.2Mt niobium resource sitting below the 2% TREO reporting cut-off threshold. The additional non-overlapping Nb-only material reported at 0.20% Nb₂O₅ cut-off increases the combined unique Mineral Resource tonnage to approximately 146Mt. Although this material is lower-grade in rare earths, it contains valuable niobium and, when combined with the primary TREO-defined resource boosts the project’s total contained Nb₂O₅ inventory to approximately 770,000t.
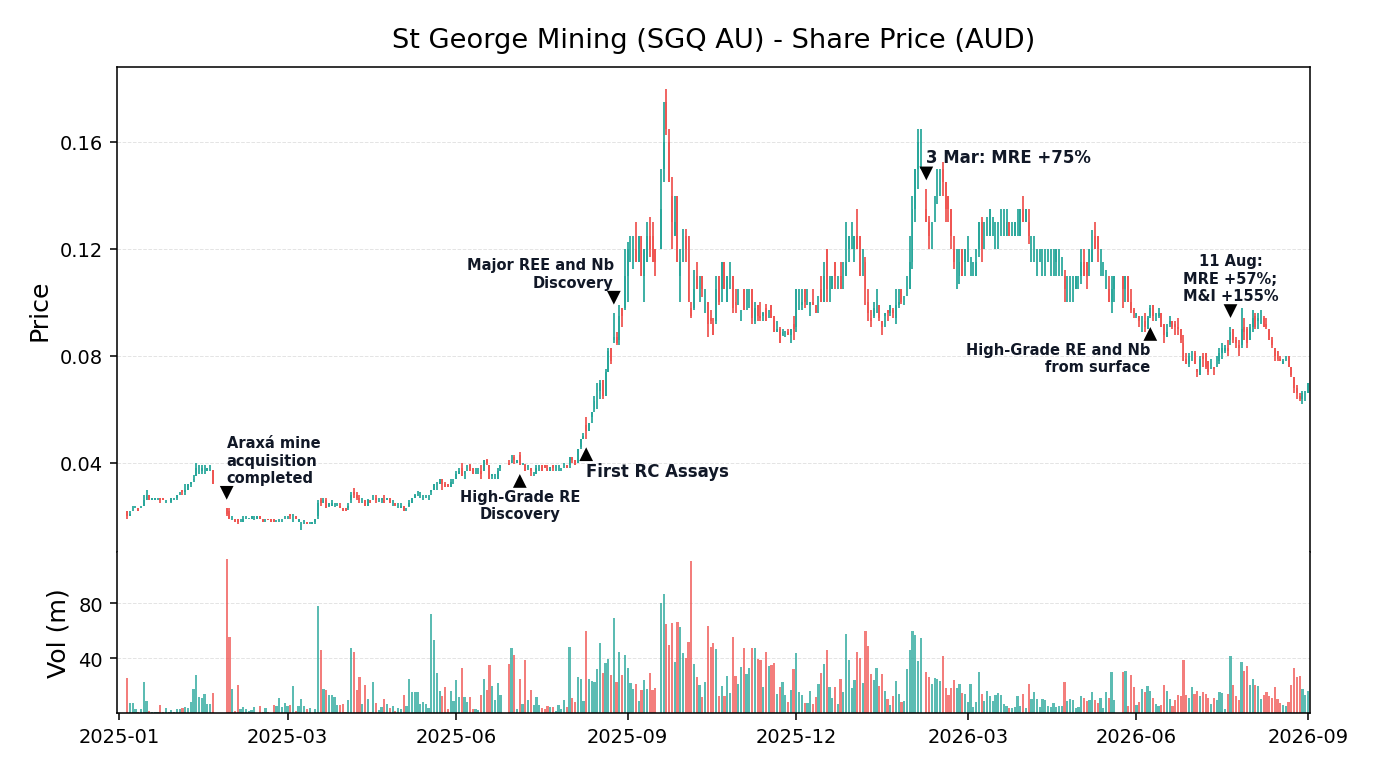
Source: Company, Shenton Research.
Although most niobium is currently used to manufacture high-end steel, we expect non-steel niobium demand growth to outpace steel-related demand growth, given niobium’s strategic role in national security and hard technology (advanced industrial applications requiring extreme material performance).
Steel applications: The established market
Ferroniobium (an iron-niobium alloy) is widely used in high-end steel production. Steelmakers add it to the melt to make high-strength low-alloy (HSLA) steel, a stronger, lighter steel grade that requires less material for the same structural performance. In HSLA steel, niobium makes up just 0.03% to 0.05% of the finished product but increases its strength by up to 30%. This enhanced steel is used widely in oil and gas pipelines, bridges, building structures and automotive lightweighting.
Non-steel applications: The growth engine
Non-steel demand is the high-growth segment, accounting for 10% of global niobium consumption in 2024. Within this segment, superalloys, new-energy materials and superconducting materials accounted for 5.4%, 2.6%, and 2.0% of total consumption respectively. Accelerating growth in these non-steel applications has tightened the market, driving ferroniobium prices from USD 25-26/kg in 2025 to approximately USD 50/kg most recently.
Aerospace and power applications are the main drivers of superalloy demand. Niobium metal melts at close to 2,500°C, and niobium alloys retain their strength above 1,700°C. Alloyed niobium has a room-temperature yield strength above 300MPa, and niobium-silicon alloys hold a tensile strength above 500MPa at 1,200°C.
These properties make niobium alloys indispensable for high-temperature, high-stress applications, particularly in defence and space systems:
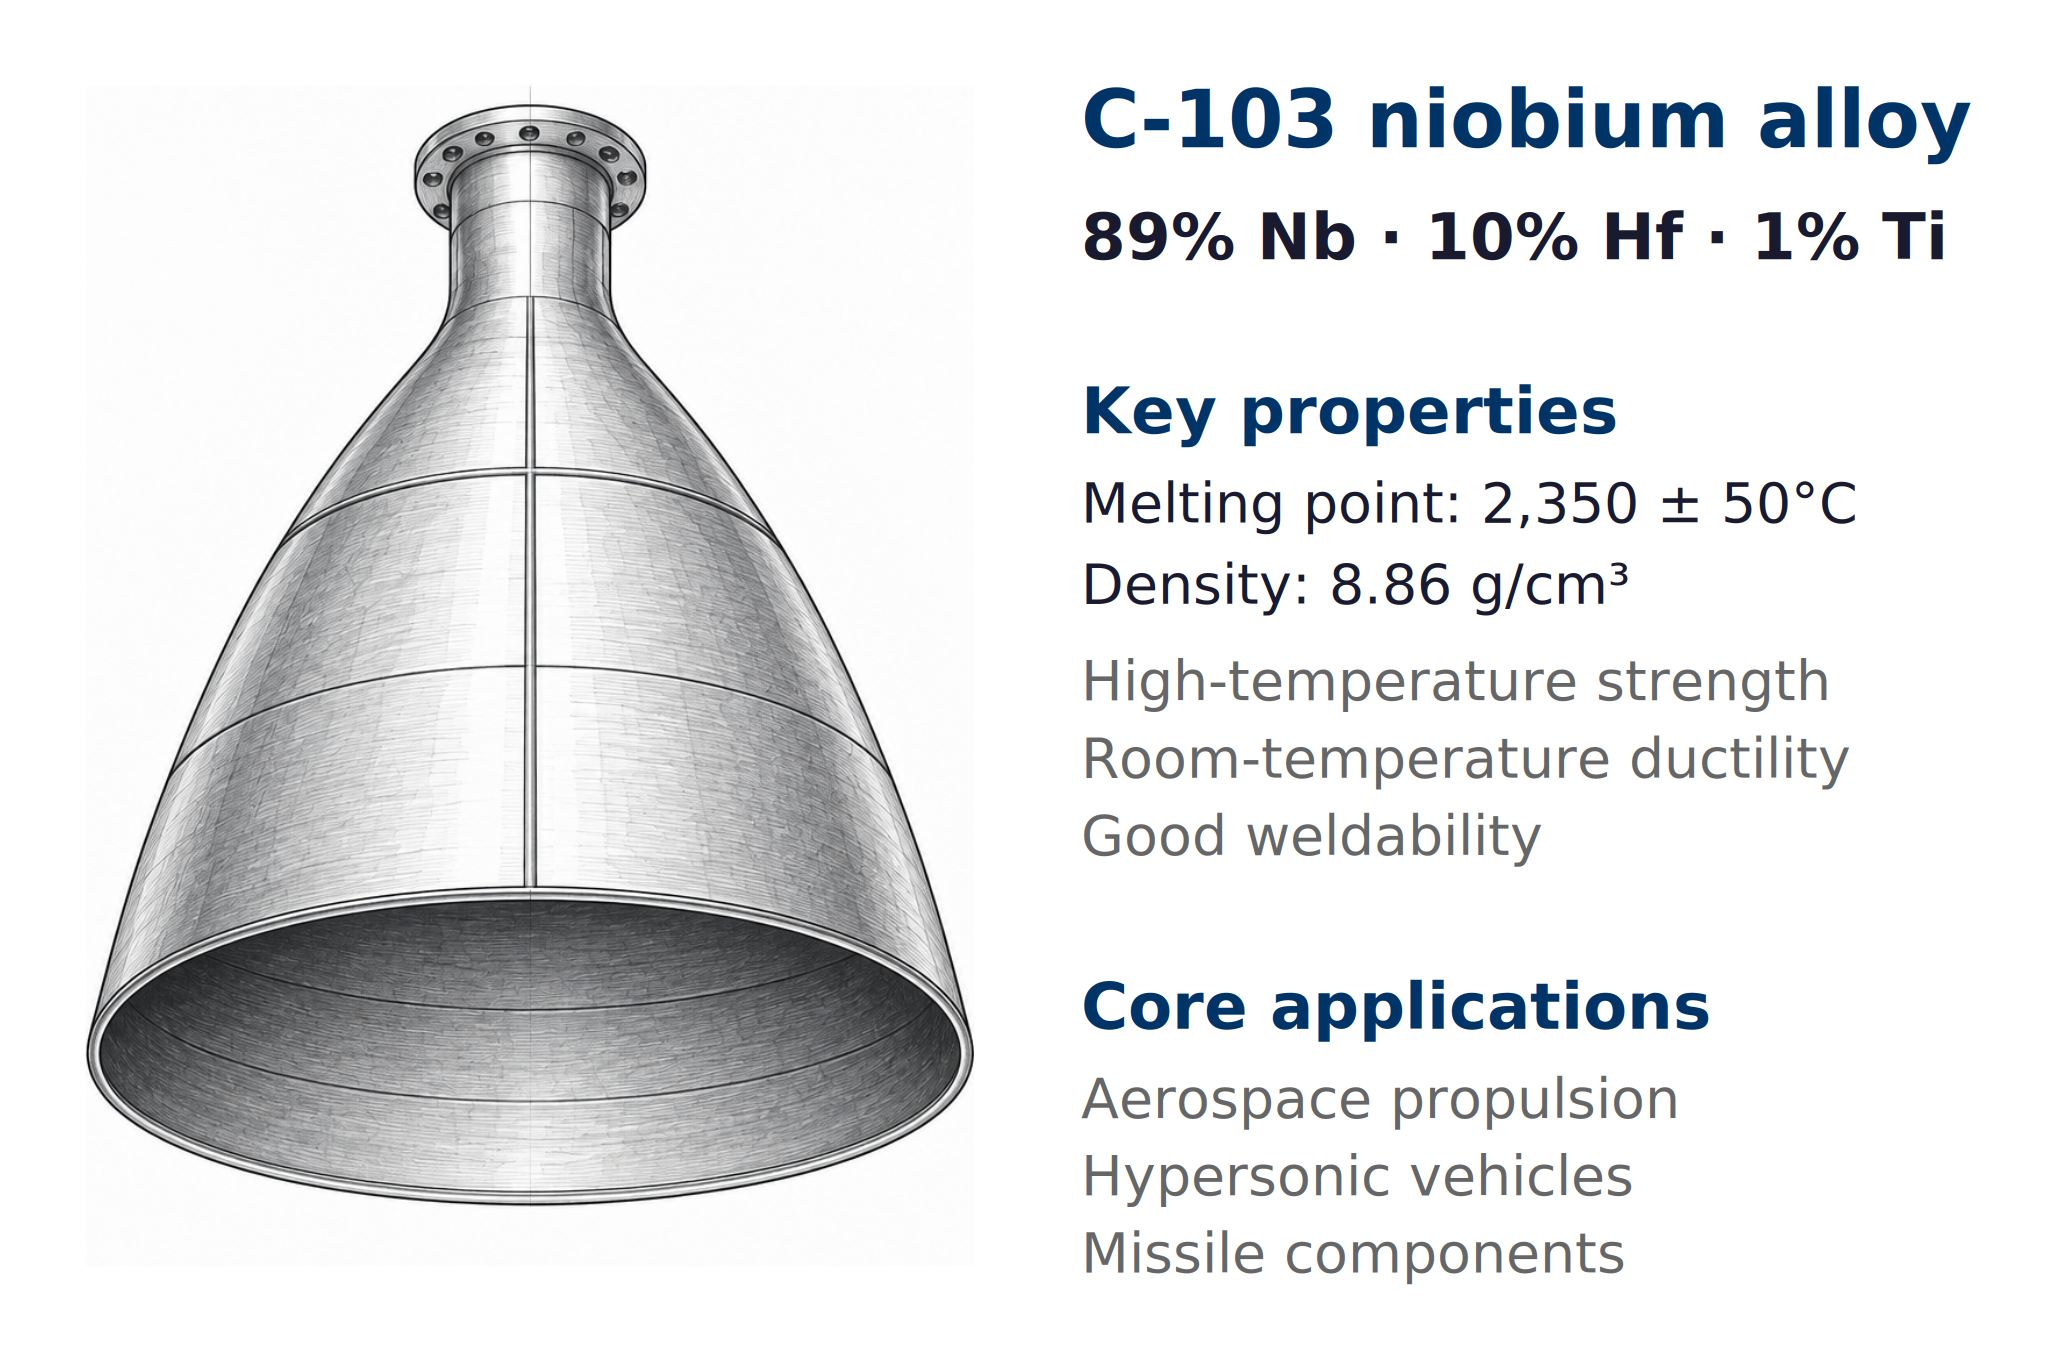
Source: Shenton Research.
Source: Shenton Research.
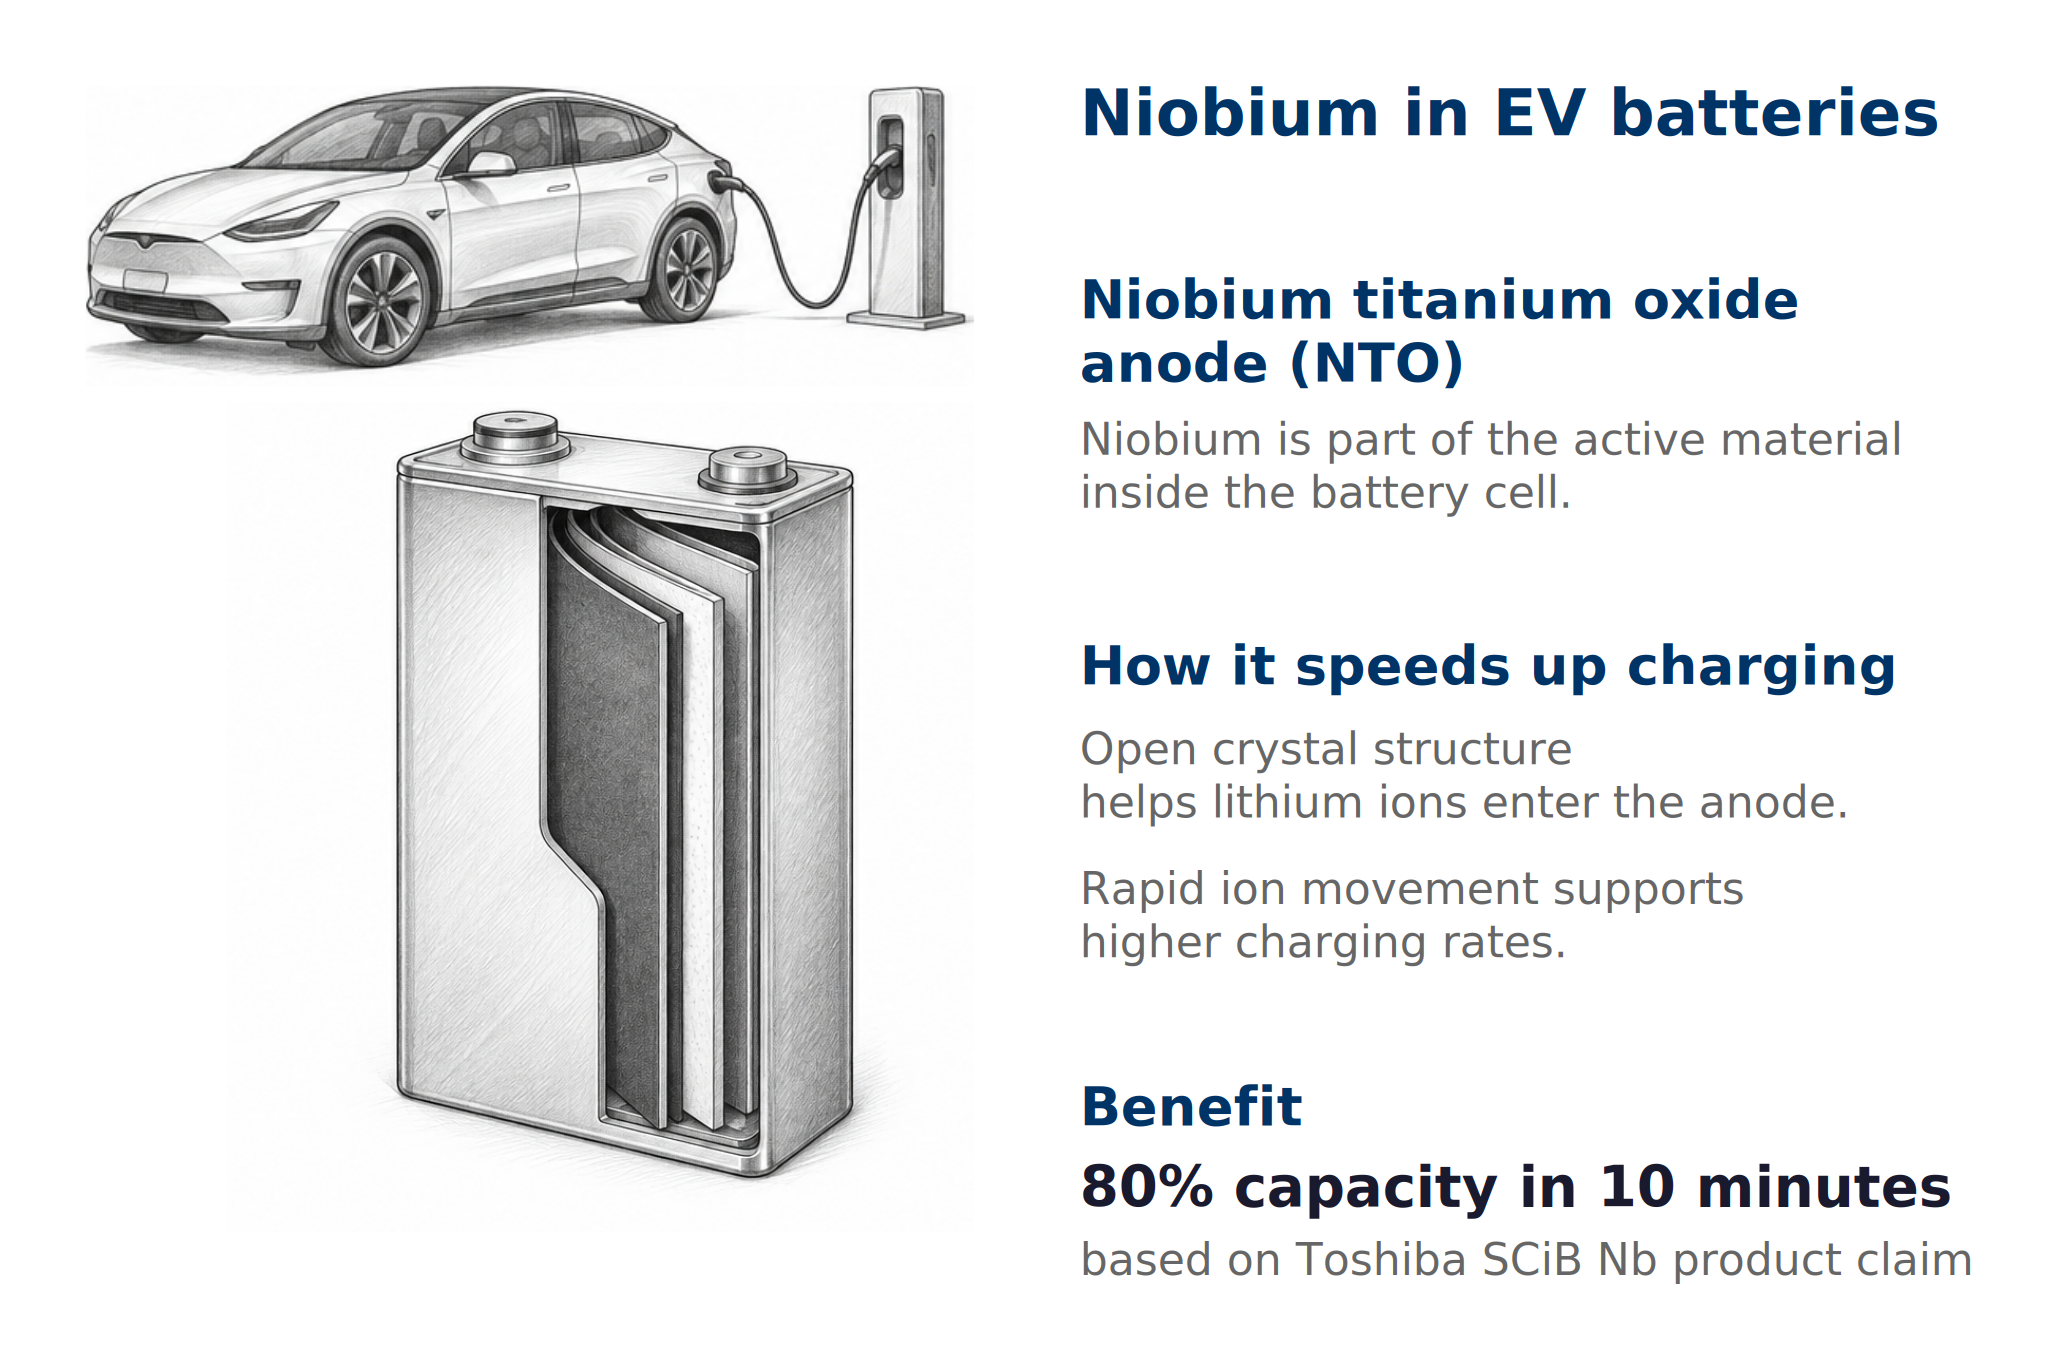
Battery materials represent the faster-growing but less proven demand option. Niobium oxides can be used as dopants in cathode materials and as high-power anode materials. The technical thesis is faster lithium-ion movement, better rate performance, improved cycle retention (ability to maintain capacity over many charge cycles) and safer fast charging. Mining firm CBMM is actively developing this market and plans to expand niobium oxide production capacity to 40,000tpa by 2030, up from 10,000tpa currently.
Niobium is also central to low-temperature superconductors. Its body-centred cubic lattice and electron structure give pure niobium a 9.25K (-263.9 degrees Celsius) superconducting critical temperature at standard pressure, the highest among elemental metals. Niobium-titanium and niobium-tin alloys are the industry-standard materials for superconducting magnets used in Magnetic Resonance Imaging (MRI) scanners, proton therapy cancer treatment systems, and high-field research magnets. Niobium cavities are used in particle accelerators, with potential longer-term demand from fusion systems and next-generation extreme ultraviolet (EUV) light-source concepts used in advanced semiconductor manufacturing.
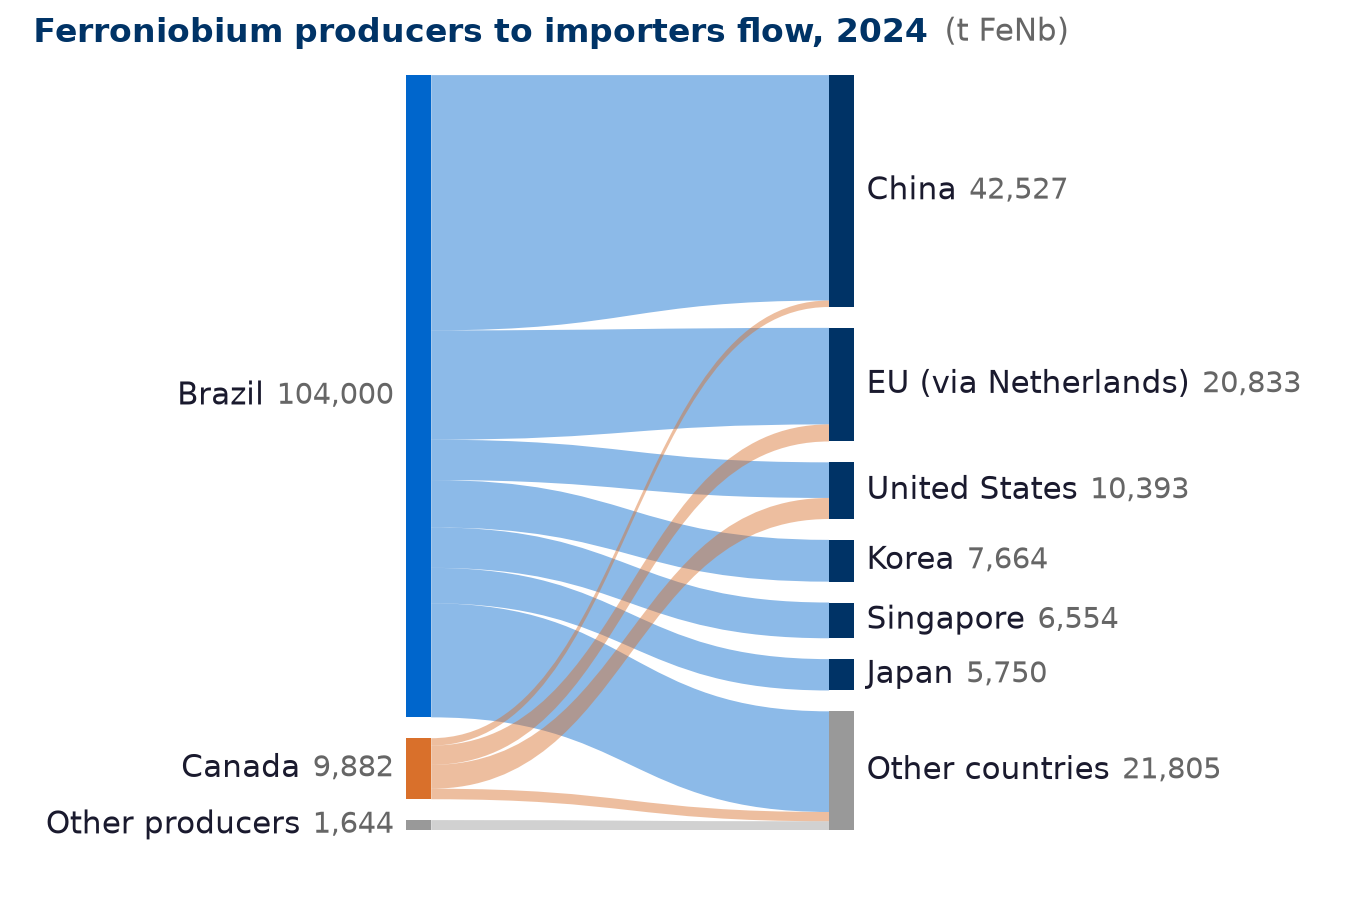
China and the United States are among the largest consumers of niobium, and both rely almost entirely on imports. China imported 42,900t of ferroniobium in 2024 against just 44t of domestic mine output. The United States imported 9,800t and has had no known domestic mine output since 1959. Together their imports equalled 47% of world niobium production.
While Brazil is the world’s largest niobium producer, China is the largest buyer, accounting for 38% of world production in 2024. The EU took a further 19% through Rotterdam and the United States accounted for 9%, of which about 40% came from Canada.
Source: UN Comtrade (export declarations), USGS, Shenton Research. Note: Gross ferroniobium tonnage.
Niobium is designated on the critical minerals lists of the United States, the EU, Australia, Canada, Japan and the United Kingdom (the EU list applies in Germany). The UK’s 2024 assessment ranks niobium first for supply risk among all critical minerals. China added it in 2026 to its own catalogue of 36 strategic minerals under the new Mineral Resources Law.
Exhibit 8: Niobium on critical minerals lists
| Country/region | Reference |
|---|---|
| United States | Final 2025 List of Critical Minerals, US Department of the Interior and USGS |
| European Union | Critical Raw Materials Act, Regulation (EU) 2024/1252; 2023 critical raw materials list |
| Australia | Critical Minerals List, Department of Industry, Science and Resources |
| Canada | Critical Minerals List, Natural Resources Canada |
| Japan | Critical minerals designated as specified critical materials under the Economic Security Promotion Act, METI and JOGMEC |
| Germany | The EU Critical Raw Materials Act. DERA-Rohstoffliste 2023, German Mineral Resources Agency (BGR) |
| United Kingdom | UK Criticality Assessment 2024, British Geological Survey for the Department for Business and Trade; Critical Minerals Strategy annex |
Source: US Department of the Interior, European Commission, Geoscience Australia, Natural Resources Canada, JOGMEC, DERA, British Geological Survey.
World niobium mine output in 2025 totalled 112,000t of ferroniobium equivalent, according to the USGS Mineral Commodity Summaries. Brazil dominated production, accounting for 92.9% of total, while Canada was the second-largest producer at 5.4%. In terms of geological reserves, Brazil’s 14.0Mt of niobium reserves represent about two-thirds of the global total.
The market operates as a near-monopoly. CBMM produces about 80% of world supply from its single, long-standing Araxá mine in Brazil, which has been in continuous operation since 1961. In 2024, it sold 95,700t of ferroniobium equivalent. CBMM has been controlled by the Moreira Salles family since 1965, with strategic minority stakes of 15% each held by a Chinese steel consortium and a joint Japanese-Korean consortium.
The second largest producer is CMOC Group (603993 CH, 3993 HK), a Luoyang-based miner listed on the Shanghai and Hong Kong stock exchanges. CMOC bought Anglo American’s Boa Vista mine and phosphate business in Goiás in Apr 2016 for USD 1.5bn. In 2025, output was 10,348t of niobium, representing 9.2% of global supply. LMG (a lithium-focused subsidiary indirectly controlled by CATL) held about 24.9%, highlighting the strategic link between niobium supply and the EV battery value chain.
The third largest producer is Niobec at Saint-Honoré, Quebec. Operating since 1976, Niobec holds a unique position as the only major niobium producer outside of Brazil. The asset was acquired from IAMGOLD in Jan 2015 for USD 530m by Magris Resources. Magris is backed by CEF Holdings (a joint venture between the CK Group and CIBC) and Temasek, Singapore’s sovereign wealth fund.
Exhibit 9: Global major and upcoming niobium players
| Owner | Mine or project | Country | Controlling owner | Status | Latest annual output | Total resource (Mt @ % Nb₂O₅) |
|---|---|---|---|---|---|---|
| CBMM | Araxá | Brazil | Moreira Salles family, 70% | Producing | 95,700t FeNb equivalent sold, 2024 | 936 @ 1.57 |
| CMOC Group | Boa Vista | Brazil | CMOC (603993 CH, 3993 HK); LMG/CATL 24.91% | Producing | 10,348t Nb, 2025 | 303 @ 0.67 |
| Magris Resources | Niobec, Saint-Honoré | Canada | Magris; CEF Holdings, Temasek | Producing | Not published | 702 @ 0.41 |
| St George Mining | Araxá | Brazil | Listed on ASX | Expect output in 2027E | Not yet in production | 111 @ 0.57 |
Source: Company, USGS, Sep 2026. % of Nb₂O₅ in blended basis. Resources rounded to the nearest integer. Note: Figures are total mineral resources.
The United States currently imports 100% of its niobium requirements. According to the UN Comtrade data for 2024, 60% of its ferroniobium imports originated from Brazil and 40% from Canada. While Brazil’s total ferroniobium exports reached 92,000t in 2024, nearly half were destined for China. The price spikes have been seen for ferroniobium products between 2021 and 2023 due to supply chain vulnerabilities. As the market tightened recently, prices have surged to about USD 50/kg.
To mitigate this import reliance, end-users and governments are actively securing strategic control over upstream assets. Recognizing the national security implications of this supply concentration, the US Department of War (formerly the Department of Defense) awarded a USD 10m grant in Aug 2025 to NioCorp for its Elk Creek project in Nebraska, currently the only niobium mine under development in the United States. Ultimately, we expect wider geographic supply to unlock latent demand stemming from Western manufacturers’ desire to reduce procurement risks.
Niobium is designated as a critical mineral by Australia (Critical Materials List), the United States (2025 List of Critical Minerals) and the European Union (Critical Raw Materials Act). The development of SGQ’s Araxá project would provide much-needed diversification for niobium procurement.
Given niobium’s status as a designated critical mineral, the development of SGQ’s project offers much-needed diversification for global procurement. The project has one of the largest unmined niobium resources in the world.
However, resource size does not guarantee economic success. Three critical pillars underpin the project’s viability: 1) mine grade, 2) expertise and 3) access to infrastructure.
Competitive Mine Grade: SGQ’s Araxá Project boasts a blended 0.57% Nb₂O₅ grade. Among global majors, this is highly competitive, above the grades currently mined at CMOC (0.43%) and Niobec (0.42%), second highest grade in the Americas to CBMM’s 1.57%.
Specialised Metallurgical Expertise: Converting pyrochlore (the primary niobium-bearing ore mineral) into ferroniobium requires a highly specialised processing chain. While established producers have years of large-scale experience, SGQ has bridged this knowledge gap by recruiting former senior CBMM managers to lead its technical and metallurgical operations.
Established Infrastructure: The project benefits immensely from its immediate proximity to CBMM’s Araxá mine. The area is already served by sealed roads, grid power from renewable supply, water and telecommunications. Furthermore, established rail and port networks are readily available for export logistics. To support future processing facilities, SGQ also acquired 166ha of industrial-zoned land within 2km of the tenure for BRL 14m in Feb 2026.
We expect the company to emerge as a major new player in global niobium production, a trajectory supported by early commercial traction. The company secured preliminary offtake agreements. Specifically, SKI Hong Kong and Liaoning Fangda have signed non-binding MoUs for 20% of niobium output each. In addition, Shandong Xinhai holds a binding MoU to negotiate an EPC+F contract to develop the St George mine, which may also include marketing rights for niobium sold into China. The company is also actively advancing offtake negotiations with buyers from the US, Asia and Europe to secure the remaining production volume.
According to USGS estimates, global rare earth reserves exceed 75.0Mt REO. China holds 44.0Mt and produced 270,000t in 2025. Brazil holds 11.0Mt of rare earth reserves but produced only 2,000t, representing just 0.5% of global output.
The large gap between reserves and production reflects Brazil’s stage of development. Serra Verde is the only producing rare earth mine in Brazil, with a Phase 1 designed output of 5,000tpa of rare earth oxide. Araxá, Caldeira and Monte Alto remain in the development phase.
Exhibit 10: Rare earth reserves and 2025 mine production
| Country | Reserves (t REO) | 2025 mine production (t REO) |
|---|---|---|
| China | 44,000,000 | 270,000 |
| Brazil | 11,000,000 | 2,000 |
| Australia | 6,300,000 | 29,000 |
| Russia | 3,800,000 | 2,600 |
| Vietnam | 3,500,000 | 150 |
| United States | 1,900,000 | 51,000 |
| World total | >75,000,000 | 390,000 |
Source: USGS Mineral Commodity Summaries, Feb 2026.
China accounted for 69.2% of 2025 global output and historically supplied 71.0% of US rare earth compound imports between 2021 and 2024. Given China’s dominant supplier positioning, its export controls are accelerating rare earth development globally. In Apr 2025, it implemented export controls restricting the overseas sale of seven critical elements including dysprosium and terbium.
Exhibit 11: Global major and upcoming rare earth players
| Owner | Mine or project | Country | Deposit type | Status | Total resource and reserve (% of TREO) | RE class (magnet share of TREO) |
|---|---|---|---|---|---|---|
| Lynas Rare Earths | Mt Weld | Australia | Hard-rock | Producing | 109Mt @ 4.20 | Light |
| MP Materials | Mountain Pass | USA | Hard-rock | Producing | 44Mt @ 5.27 | Light, 16.4% NdPr |
| Meteoric Resources | Caldeira | Brazil | Ionic clay | Developing | 1,631Mt @ 0.23 | Light, 22.3% magnet REO |
| Brazilian Rare Earths | Monte Alto | Brazil | Hard-rock | Developing | 3.4Mt @ 11.26 | Light, 16.5% NdPr |
| St George Mining | Araxá | Brazil | Hard-rock | Developing | 111Mt @ 3.57 | Light, 19.0% NdPr, 2.8% heavy |
Source: Company. Resources rounded to the nearest integer where applicable. Note: Araxá’s heavy share is total HREO of 990ppm as a share of TREO, per Table 9 of the Aug 2026 MRE.
Outside China, the two main producers at scale are Australia-based Lynas Rare Earths (LYC AU) and US-based MP Materials (MP US). In FY26 (year ended 30 June), Lynas produced 13,089t of REO (including 7,260t of NdPr) from its Mt Weld ore in Western Australia. In 2025, MP Materials produced 50,692t of REO in concentrate and 2,599t of separated NdPr oxide at Mountain Pass in California.
Buyers are paying premiums for supply security. In Jul 2025, the US Department of War acquired a 15% stake in MP Materials and committed to purchasing 100% of magnet output with a USD 110/kg NdPr price floor for ten years. In a similar vein, a US government-backed special purpose vehicle committed to purchasing 100% of Serra Verde’s Phase 1 output. Elsewhere in Brazil, REAlloys, an Ohio-based manufacturer of rare earth alloys and magnets for US defence and industrial customers, is targeting up to 40% of Araxá’s rare earth output. SGQ and REAlloys signed the MoU in Sep 2025.
In this wave of strategic developments, SGQ is emerging as a major rare earth player. One of the company’s key differentiators is that its Measured and Indicated (M&I) contained NdPr oxide exceeds that of established assets like Mt Weld and Mountain Pass.
SGQ’s shareholder base includes a strategic mix of institutional and high net worth (HNW) investors. Private Australian resource group Hancock Prospecting is a major shareholder with a 9.1% stake. Its executive chairman, Gina Rinehart, is among Australia’s richest people. Beyond SGQ, Hancock Prospecting is also a shareholder of MP Materials and Lynas, two leading non-Chinese rare earth producers in the world.
Management interests are closely aligned with shareholders through direct equity ownership. Executive Chairman John Prineas is a founding shareholder and director with over 25 years of commercial, legal and finance roles in the mining sector. Prior to founding SGQ, he was Chief Operating Officer and Country Head of Dresdner Bank in Sydney. He holds a 1.8% stake in the company. The other two directors, John Dawson and Sarah Shipway, hold a combined 1.7% stake in SGQ.
SGQ has appointed former CBMM executives and technical specialists across its Brazil operations, ESG, mineral processing and plant engineering teams. This provides the Araxá team with direct operating experience in pyrochlore processing, licensing, and niobium plant construction.
Exhibit 12: SGQ team members with CBMM background
| Person | SGQ role | Former CBMM background |
|---|---|---|
| Thiago Amaral | Brazil Country Head, formerly Director of ESG and Technical Development | CBMM Araxá from 2007 to 2024. Sustainability, quality, product regulation and China business development |
| Adriano Rios | Director of Operations, formerly Consultant for Mining Operations | CBMM Araxá from 1996 to 2020. Production Manager and former COMIPA Director of Operations |
| Ricardo Maximo Nardi | Lead Processing Engineer, formerly Consultant for Mineral Processing | Former Head of Mineral Processing at CBMM, with more than 30 years in niobium processing |
| Carlos Alberto de Araujo | Chief Plant Engineer | Managed design, construction and commissioning of CBMM’s niobium processing plant |
| Juliano Bianco | Specialist Engineer | Worked on design, construction and commissioning of CBMM’s metallurgical and oxide niobium processing plant |
Source: Company.
Our target price of AUD 0.53 is based on a risked sum-of-the-parts NPV methodology. We model unlevered discounted cash flows (DCFs) for the niobium and rare earth projects from FY27E to FY45E, applying a 10% discount rate.
We value the niobium asset at USD 1,278m, accounting for 78% of risked enterprise value. Key assumptions include Stage 1 production at 5,000t a year of ferroniobium (FeNb) from 2H2027, expanding to 9,800tpa in Stage 2 (FY31E) with annual operating profit reaching USD 414m.
We assume a 50% metallurgical recovery rate to FeNb, the midpoint of the open-circuit flotation tests. We use a flat FeNb price of USD 50/kg for the forecast period and apply an 80% risk factor to the niobium NPV.
We value the rare earth asset at USD 282m, accounting for 17% of risked value after applying a 50% risk factor. We forecast output to reach 10,800t of total rare earth oxide (TREO) in mixed rare earth carbonate (MREC) by FY33E at USD 33/kg.
This yields a total risked enterprise value of USD 1,633m, and a risked equity valuation of USD 1,689m, resulting in our AUD 0.53 target price.
Exhibit 13: Key valuation assumptions
| Item | Value |
|---|---|
| Discount rate | 10% |
| FeNb price | USD 50/kg, flat |
| Stage 1 capacity | 5,000tpa FeNb from 2H 2027 |
| Stage 2 capacity | 2Mtpa mill from FY31E, 9,800tpa FeNb |
| Nb₂O₅ grade | 0.65% in the mine inventory, against 0.57% for the whole MRE |
| Recovery to FeNb | 50% |
| Mine life | 18 years |
| Operating cost, FeNb | USD 9/kg Stage 1, USD 8/kg Stage 2 |
| Growth capex | USD 130m niobium FY27E to FY28E, USD 260m rare earths FY30E to FY31E |
| Rare earths plant | 200ktpa from FY33E, 3.2Mt at 9.0% TREO, 60% to MREC |
| MREC price | USD 33/kg TREO, flat |
| Risk factors | 80% for niobium project, 50% for rare earth project |
Source: Company, Shenton Research estimates.
Exhibit 14: Summary of DCF model (10 years)
| USDm, June year-end | FY27E | FY28E | FY29E | FY30E | FY31E | FY32E | FY33E | FY34E | FY35E | FY36E |
|---|---|---|---|---|---|---|---|---|---|---|
| FeNb production (t) | - | 2,500 | 5,000 | 5,000 | 8,617 | 9,848 | 9,848 | 9,848 | 9,848 | 9,848 |
| TREO in MREC (t) | - | - | - | - | 2,700 | 6,750 | 10,800 | 10,800 | 10,800 | 10,800 |
| Niobium revenue | - | 125 | 250 | 250 | 431 | 492 | 492 | 492 | 492 | 492 |
| Rare earths revenue | - | - | - | - | 89 | 223 | 356 | 356 | 356 | 356 |
| Total revenue | - | 125 | 250 | 250 | 520 | 715 | 849 | 849 | 849 | 849 |
| Operating costs | - | (23) | (45) | (45) | (103) | (165) | (202) | (202) | (202) | (202) |
| Corporate and exploration | (17) | (7) | (7) | (7) | (7) | (7) | (7) | (7) | (7) | (7) |
| EBITDA | (17) | 96 | 198 | 198 | 410 | 544 | 640 | 640 | 640 | 640 |
| Tax | - | (13) | (50) | (46) | (105) | (146) | (174) | (174) | (174) | (174) |
| Working capital | - | (23) | (23) | - | (49) | (35) | (24) | - | - | - |
| Capex | (15) | (135) | (20) | (150) | (150) | (20) | (20) | (20) | (20) | (20) |
| Free cash flow | (32) | (75) | 106 | 3 | 106 | 343 | 422 | 446 | 446 | 446 |
| Present value at 10% | (31) | (65) | 84 | 2 | 69 | 203 | 227 | 218 | 198 | 180 |
Source: Shenton Research estimates. Note: Mine life runs to FY45E, when the 31.4Mt niobium inventory is exhausted.
Exhibit 15: Sum-of-the-parts valuation
| USDm unless stated | Unrisked | Risk factor | Risked |
|---|---|---|---|
| Niobium project NPV | 1,597 | 80% | 1,278 |
| Rare earths project NPV | 564 | 50% | 282 |
| Residual resource, niobium | 16 | 16 | |
| Residual resource, rare earths | 127 | 127 | |
| Corporate costs and exploration | (70) | (70) | |
| Enterprise value (USDm) | 2,235 | 1,633 | |
| Net cash, June 2026 (USDm) | 56 | 56 | |
| Equity value (USDm) | 2,291 | 1,689 | |
| Equity value (AUDm) | 3,321 | 2,449 | |
| Shares (m) | 4,639 | 4,639 | |
| Value per share (AUD) | 0.72 | 0.53 |
Source: Company, Shenton Research estimates.
Our sensitivity analysis shows that a ±10% change in the FeNb price moves the niobium NPV by ±13% and the value per share by ±10%. A ±1ppt change in the discount rate moves it by +9% or -8%. Increasing recovery to 60%, the top of the tested range, adds 14% to the value per share.
Upside to our valuation. Near-term resource growth is the main catalyst. As of Aug 2026, SGQ’s MRE covers less than 20% of the project area. The current resource is modelled only to about 180m below surface.
Mineralisation remains open in all directions. Deeper and wider drilling could expand the resource base. The most immediate upside could come from East Araxá, located about 1km east of the main deposit. This area sits outside the current MRE, and the company is targeting a maiden resource update for Q4 2026.
This glossary defines the short names and technical abbreviations used across the report.
Exhibit 16: Glossary of short names
| Short name | Meaning in this report |
|---|---|
| Araxá | St George Mining’s niobium and rare earths project in Minas Gerais, Brazil |
| BGR | German Federal Institute for Geosciences and Natural Resources |
| C-103 | Niobium-based refractory alloy used in high-temperature aerospace applications |
| CBMM | Companhia Brasileira de Metalurgia e Mineração, the dominant Brazilian niobium producer |
| CMOC | CMOC Group, listed in Shanghai and Hong Kong, owner of the Boa Vista niobium operation in Brazil |
| DERA | German Mineral Resources Agency |
| DoW | US Department of War, formerly the Department of Defense |
| EPCM | Engineering, procurement and construction management |
| ESG | Environmental, social and governance |
| FeNb | Ferroniobium, the standard niobium alloy product sold into steelmaking |
| FID | Final investment decision |
| HREO | Heavy rare earth oxides, including dysprosium, terbium, yttrium and related heavy rare earth oxides where disclosed |
| HSLA | High-strength low-alloy steel |
| Indicated | Mid-confidence JORC mineral resource category |
| Inferred | Lower-confidence JORC mineral resource category |
| JORC | Australasian Code for Reporting of Exploration Results, Mineral Resources and Ore Reserves |
| ktpa | Thousand tonnes per annum |
| M&I | Measured and Indicated resource categories |
| Measured | Highest-confidence JORC mineral resource category |
| MoU | Memorandum of Understanding |
| MRE | Mineral Resource Estimate |
| MREC | Mixed rare earth carbonate |
| MREO | Magnet rare earth oxides, usually NdPr plus dysprosium and terbium oxides where disclosed |
| Mt | Million metric tonnes |
| Mtpa | Million tonnes per annum |
| Nb | Niobium |
| Nb₂O₅ | Niobium pentoxide, the oxide basis used for niobium resource grades |
| NdPr | Neodymium and praseodymium oxides, the main magnet rare earths |
| Niobec | Canadian primary niobium mine at Saint-Honoré, Quebec |
| ppm | Parts per million |
| RC Assay | Assay result from reverse circulation drilling |
| RE | Rare earth, used as shorthand in table headings such as RE class |
| REE | Rare earth elements |
| REO | Rare earth oxide |
| SRK | SRK Consulting, the independent consultant for the Aug 2026 Araxá MRE |
| t | Metric tonne |
| tpa | Tonnes per annum |
| TREO | Total rare earth oxide |
| USGS | United States Geological Survey |
This report has been prepared and issued in consideration of a fee payable by St George Mining Ltd.
This report is produced by subsidiaries and affiliates of Shenton Research Pte Ltd (hereafter Shenton Research). This report may contain material that is not directed to, or intended for distribution to or use by, any person or entity who is a citizen or resident of or located in any locality, state, country or other jurisdiction where such distribution, publication, availability or use would be contrary to law or regulation or which would subject Shenton Research to any registration or licensing requirement within such jurisdiction. All material presented in this report, unless specifically indicated otherwise, is under copyright to Shenton Research. None of the material, nor its content, nor any copy of it, may be altered in any way, transmitted to, copied or distributed to any other party, without the prior express written permission of Shenton Research. All trademarks, service marks and logos used in this report are trademarks or service marks or registered trademarks or service marks of Shenton Research or its affiliates.
The information, tools and material presented in this report are provided to you for information purposes only and are not to be used or considered as an offer or the solicitation of an offer to sell or to buy or subscribe for securities or other financial instruments. Shenton Research may not have taken any steps to ensure that the securities referred to in this report are suitable for any particular investor. Shenton Research will not treat recipients of this report as its customers by virtue of their receiving this report. The investments and services contained or referred to in this report may not be suitable for you and it is recommended that you consult an independent investment advisor if you are in doubt about such investments or investment services. Nothing in this report constitutes investment, legal, accounting or tax advice, or a representation that any investment or strategy is suitable or appropriate to your individual circumstances, or otherwise constitutes a personal recommendation to you. Shenton Research does not advise on the tax consequences of investments and you are advised to contact an independent tax adviser. Please note in particular that the bases and levels of taxation may change. Information and opinions presented in this report have been obtained or derived from sources believed by Shenton Research to be reliable, but Shenton Research makes no representation as to their accuracy or completeness. Shenton Research accepts no liability for loss arising from the use of the material presented in this report, except that this exclusion of liability does not apply to the extent that such liability arises under specific statutes or regulations applicable to Shenton Research. This report is not to be relied upon in substitution for the exercise of independent judgment.
The information contained in this report has been compiled by the Research Department of Shenton Research from sources that it believes to be reliable but no representation, warranty or guarantee is made or given by Shenton Research or any other person as to its accuracy or completeness. All opinions and estimates expressed in this report are (unless otherwise indicated) entirely those of Shenton Research as of the date of this report only and are subject to change without notice. Shenton Research may have issued, and may in the future issue, other communications that are inconsistent with, and reach different conclusions from, the information presented in this report. Those communications reflect the different assumptions, views and analytical methods of the analysts who prepared them and Shenton Research is under no obligation to ensure that such other communications are brought to the attention of any recipient of this report. Past performance should not be taken as an indication or guarantee of future performance, and no representation or warranty, express or implied, is made regarding future performance. Information, opinions and estimates contained in this report reflect a judgment at its original date of publication by Shenton Research and are subject to change without notice.
The price, value of and income from any of the securities or financial instruments mentioned in this report can fall as well as rise. The value of securities and financial instruments is subject to exchange rate fluctuation that may have a positive or adverse effect on the price or income of such securities or financial instruments. Investors in securities such as ADR’s, the values of which are influenced by currency volatility, effectively assume this risk. Some investments discussed in this report may have a high level of volatility. High volatility investments may experience sudden and large falls in their value causing losses when that investment is realised. Those losses may equal your original investment. Indeed, in the case of some investments the potential losses may exceed the amount of initial investment and, in such circumstances, you may be required to pay more money to support those losses. Income yields from investments may fluctuate and, in consequence, initial capital paid to make the investment may be used as part of that income yield. Some investments may not be readily realisable and it may be difficult to sell or realise those investments, similarly it may prove difficult for you to obtain reliable information about the value, or risks, to which such an investment is exposed.
This report may provide the addresses of, or contain hyperlinks to websites. Except to the extent to which the report refers to website material of Shenton Research, Shenton Research has not reviewed any such site and takes no responsibility for the content contained therein. Such addresses or hyperlinks (including addresses or hyperlinks to Shenton Research’s own website material) is provided solely for your convenience and information and the content of any such website does not in any way form part of this document. Accessing such website or following such link through this report or the Firm’s website shall be at your own risk.
Shenton Research and their respective officers, directors and employees, including persons involved in the preparation or issuance of this report, may from time to time (1) have positions in, and buy or sell, the securities of companies referred to in this report (or related investments); (2) have a consulting, investment banking or broking relationship with any company referred to in this report; and (3) to the extent permitted under applicable law, have acted upon or used the information contained or referred to in this report including effecting transactions for their own account in an investment (or related investment) in respect of any company referred to in this report, prior to or immediately following its publication.
Want this report as a PDF, or to talk it through with the analyst?